How Charts and Graphs can be Misleading

Let’s take our 5 months of data
Table of Contents
| 4.2 Lakhs |
| 4.3 Lakhs |
| 4.1 Lakhs |
| 4.4 Lakhs |
| 4.5 Lakhs |
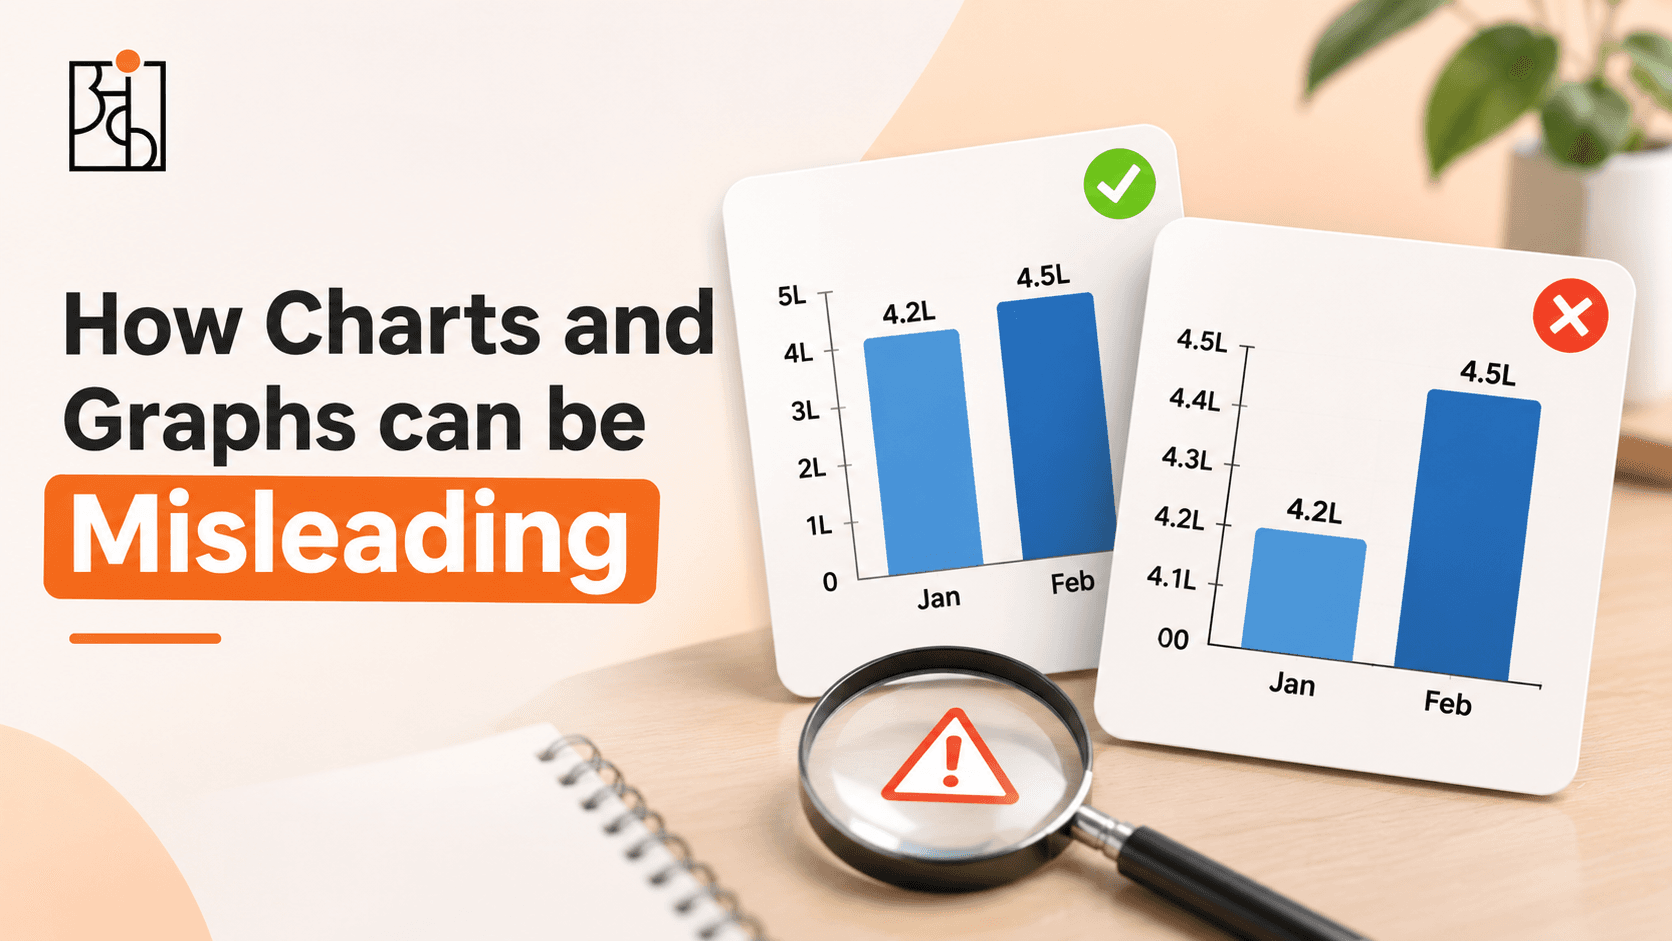
If we plot this into a line chart with the y-axis going from 0 to 5 we will get a flat line. However, if we have the y-axis go from 4.0 to 4.6 the line will look like a rocket shooting up. Both scenarios have the same data but one will cause you to shrug whilst the other gives you an extra budget.
The key here is that there is no deception, this is why charts can be so powerful but can also be slightly dangerous. Charts can make you feel a certain way about the data. Most of us feel first and think later. At Ankashram we see this often. Usually in a room where a decision needs to be made within a minute of seeing the chart and no one goes back to question what isn’t being shown. Here are the most common ways charts can influence and how to spot them.


1. Y-axis doesn’t start at 0
This is a classic. Bar charts show the length of something so the longer the bar the more there is. Using a Y-axis that does not start at 0 will give inaccurate comparisons. If two products have sold 96 and 100 units there is a 4% difference. However if you set your y-axis to start at 95, you will get bars that are 1 and 5. This makes it appear like one product is 5 times bigger than the other. When people are busy they won’t look at the y-axis, they will just look at the length. Line charts are slightly different. Having a chart that doesn’t start at 0 can be justified when monitoring something like a share price or temperature. However, it is important to know where the axis starts.
2. Chart skewed
Even if your axis is accurate, the proportions of the chart can be misleading. Making a chart tall and skinny will cause a gentle slope to look steep. Whereas a wide and short chart will cause it to look flat. There is nothing wrong with the data, it is just that the frame is influencing you. If there is a noticeable trend ask yourself if the numbers on the axis match the impact or is it just a tall chart?
3. Dual Axis
Having two lines on the same chart with two different scales can be very useful, but can also be misleading. By having two scales you can make almost any two lines look related. If the left axis (ad spend) goes from 0 to 10 Lakh and the right axis (sales) goes from 40 to 60 Lakh you can easily make the lines wrap around each other by tweaking the scales. This will make it seem like there is proof that the ads caused the sales. Whereas if you change the right axis the lines will begin to separate and the story will disappear. Because each axis is chosen individually you can tweak the chart to show what you want. When you see two scales on the same chart ask yourself if there is a link.
4. Cumulative Chart
Cumulative charts add each period onto the previous. This means the line can only go up or remain the same. This can be useful to show overall progress towards a target, but can be misleading if showing how the business is currently doing.
Your sales could have gone down each month from 50 lakh to 45 to 40. This would indicate issues in your business. However, on a cumulative chart the line will keep increasing as you are still adding something positive each month. The decrease will be hidden in the curve of the graph.
If the chart always looks like it is increasing ask yourself what would it look like if you looked at each month.
5. Start Date
Every chart will have a start date. Choosing the start date can be misleading. Starting just after a bad quarter will create a nice recovery story. However, starting at a high point will show a downwards trend. Only showing the last 3 months will turn a usual seasonal fluctuation into a trend. This is where many growth slides come from. The data is accurate but the time frame has been chosen, intentionally or not.
A quick check you can do is ask to see the chart for a longer time frame. Ideally including the same time frame from last year. If the pattern repeats every year it is not news, it is just the calendar.
6. Chart Type – Sizes, Slices & 3D
Some chart types just can’t be accurately read by the human eye and can therefore be misleading.
Pie charts can be useful when you have a couple of slices with large differences. Once you have more than a couple of slices we aren’t good at understanding the difference in angles. If you have a pie chart with 8 slices that are similar in size it becomes almost impossible to read. If it is 3D the slices in the front will look bigger than those at the back, even if they are the same.
Bubble and icon charts can also be misleading. If you have a bubble that is twice as wide to represent something being twice as big you are actually making it 4 times bigger. This will make small differences look massive. If you are relying on areas, angles or 3D to convey the message then a basic bar chart with numbers on will usually be a better indicator.
7. Percentages with no baseline
Seeing 100% increase in complaints sounds like a disaster. However, if there were only 2 complaints and now there are 4 it is a completely different conversation than if there were 2000 complaints and now there are 4000. 0.2% increase in sales could be a rounding error or a real result depending on how big the item is. Not having the underlying numbers for percentages is one of the easiest ways to make small changes look big or big changes look small. Whenever you see a percentage change look for the raw numbers. If there aren’t any, ask for them.
8. Minor Tweaks
There are a few more tricks but most aren’t really tricks, just default settings.
- Smoothed Line – This can make a volatile and unpredictable metric look stable. If the numbers are fluctuating a lot then a smoothed line is telling you a calmer story than the actual data.
- Colours – Red and Green mean something. Putting a number in green will make people relax.
- Sorted – Putting the bars in alphabetical order will look messy. Whereas putting them in order of size will look like there is a clear ranking.
- No Context – Not having a target line, previous period or note about something one off will make the viewer make assumptions.
Usually not Malicious
Unfortunately it isn’t always the case that charts are being misleading due to malicious intent. Usually it is because the axis has been chosen for you. The chart is tall and someone has chosen the best looking window to make it look as good as possible in their deck. However, the outcome is the same. A budget will be approved, a product line will be cut, a team will be praised or blamed based on a chart that has subtly influenced you. The habit to protect yourself is to just check the chart.
Quick Check List
Ask yourself:
- Is the axis starting at the right place? (Specifically with bar charts.)
- What is the time frame? What happened just before?
- Is there a second axis? If yes, be suspicious of any links.
- Is it cumulative? If yes, what does it look like when looking at each period?
- Are there real numbers for the percentages?
- Are areas, angles or 3D making some things look bigger?
- Is there a baseline? (Target, previous period, last year?)
- What isn’t being shown? (Segments, outliers, uncertainty, anything unusual.)
- Creating Honest Charts
All of the above can be used to create honest charts. Start your bar charts at 0. Show the time frame you would be happy to defend including the awkward period. Label your axes clearly. Include real numbers next to your percentages. Include your target or previous period. Use the simplest chart type to answer your question. A good test is to imagine the person who would disagree the most with your conclusion looking at your chart. Would they say it is fair? If so then you have probably created a good chart.
Read More: Custom Corporate Training in Data
The Mindset
Charts aren’t your enemy. They are one of the best tools we have to help people see trends they wouldn’t see in a table. We don’t want to be sceptical of every chart but we do want to see charts as the start of a conversation. Asking a few quick questions. This is the mindset we encourage at Ankashram with our Think With Data approach. Whilst tools and chart types change all the time, the instinct to ask what isn’t being shown and what is it being compared to will apply to every chart you will ever see. The more people on your team have this mindset the less decisions will be made based on a nice looking line.
Read More: What Happens When Data Is Inaccurate?
Frequently Asked Questions
Q1.Can a chart be misleading even if the data is accurate?
Yes. Charts can be misleading based on the axis, time frame, chart type, colours and what isn’t being shown. Even if the data is accurate people can be led to a conclusion that the data does not truly support.
Q2.Should bar charts always start at 0?
Generally yes. Bar charts show the length of the bar so having a truncated axis will cause misleading comparisons. Line charts have more flexibility as they are showing trends over time however the starting point should be clear.
Q3.Why are dual axis charts seen as risky?
Having two scales means you can easily make the two lines look very related or completely unrelated. This makes it easy to suggest a link that does not exist so any links should be questioned based on the underlying numbers.
Q4.Why are cumulative charts an issue?
Cumulative charts can only go up or stay the same. This can make the chart look positive even though each period is underperforming. They are useful for tracking progress towards a total but not useful for seeing how the business is currently doing.
Q5.How can I quickly tell if a chart is trying to persuade me?
Check if the axis starts at the right place, what the time frame is, if there is a second axis, if there are real numbers for the percentages and what isn’t being shown (Baseline, target.) Usually this can be done in a minute and will show if the chart is neutral or biased.
Q6.How does Ankashram help teams read charts critically?
We encourage everyone to have a critical mindset when looking at charts with our Think With Data approach. We have interactive sessions based on real examples to help everyone build this mindset. This means decisions are made based on evidence, not how nice the chart looks.