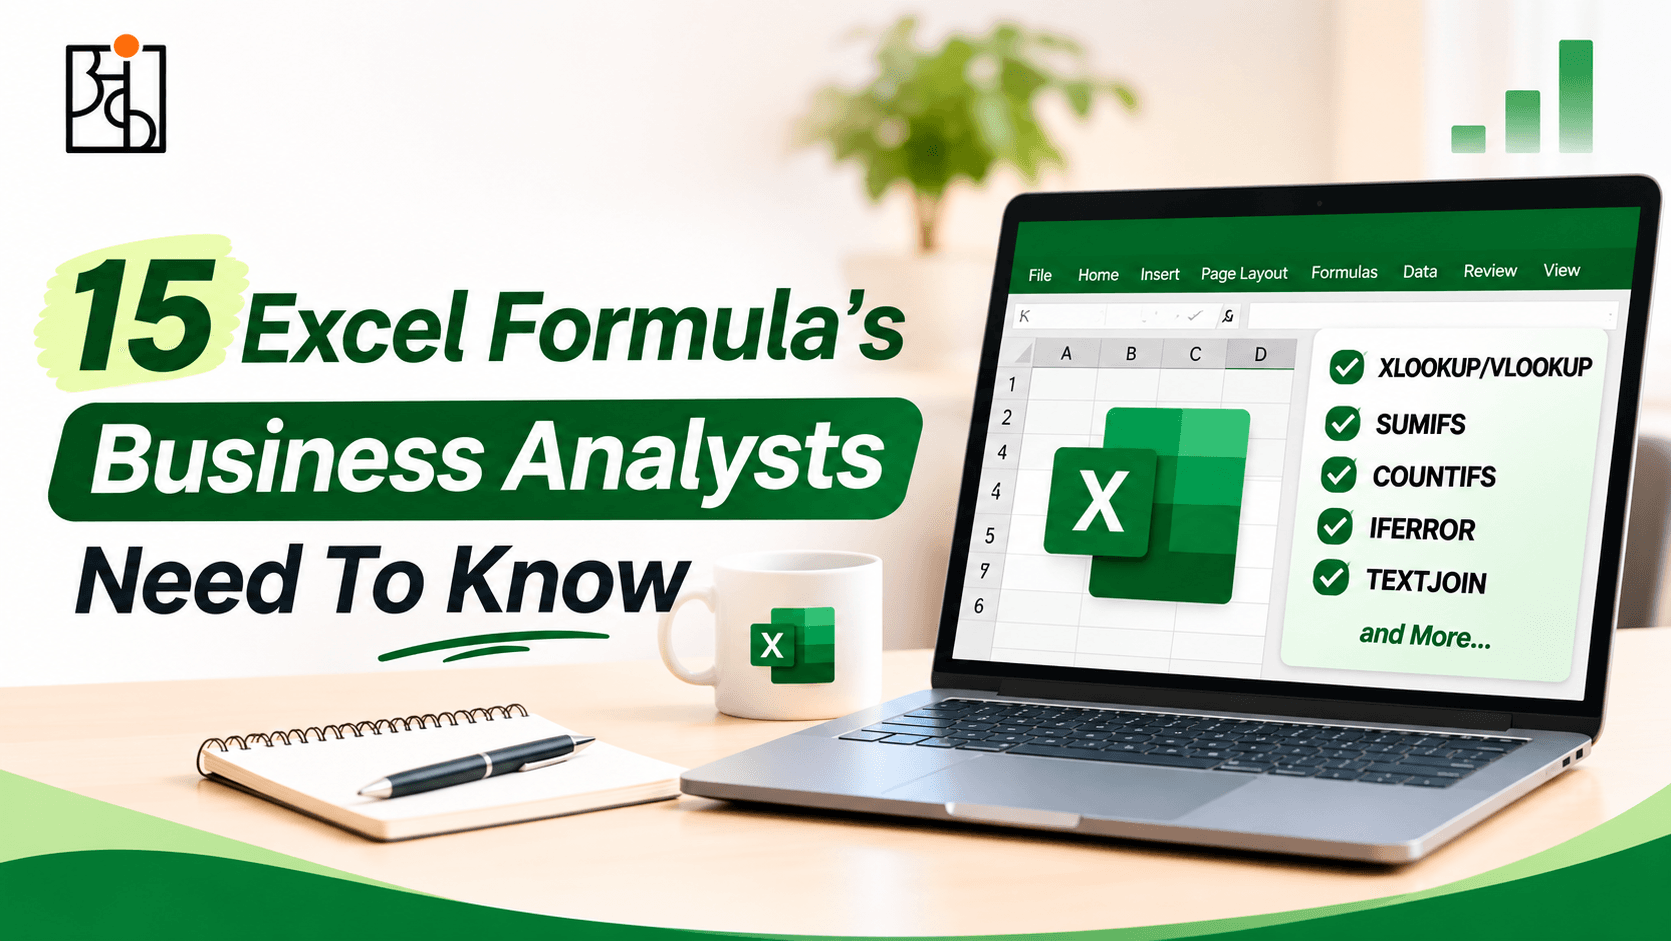
15 Excel Formula’s Business Analysts Need To Know

Most business analysts will know that a large amount of their time is spent in spreadsheets. Often you will be given some data, tidying it up and trying to find any patterns to help answer any questions you have prior to meetings.
Table of Contents
Often knowing a handful of formulas can help you flow through the process with ease.
Below are 15 formulas that are always super useful for Business Analysts:


1. XLOOKUP/VLOOKUP
This is the most common lookup formula. If you need to bring across a value from a different table using an ID or Name, XLOOKUP is a much cleaner, flexible option. You can look left or right and deal with blanks better.
2. INDEX & MATCH
INDEX will bring back a value from a range of cells, whilst MATCH will look up the position of something. This is a go-to for anyone who can’t use XLOOKUP.
3. SUMIFS
This formula allows you to sum values based on multiple conditions. For example if you wanted to know the total revenue for a certain region in a certain month. This is one of the most used functions.
4. COUNTIFS
This will count how many rows meet your multiple conditions. This can be useful if you want to know how many orders you have, how many customers in a certain segment or how many deals you closed above a certain value.
5. AVERAGEIFS
This does the same thing as SUMIFS & COUNTIFS but averages values. If you want to know the average deal size for a certain product line or region this can be done quickly.
6. IF/IFS
This formula is great for using conditions. You can highlight rows that meet a condition, categorise them or create simple status fields. IFS allows you to have multiple conditions.
7. IFERROR
This will stop any nasty error messages popping up. If you wrap any formula in IFERROR you can return a blank, 0 or message of choice. This means your reports will look much cleaner.
8.TEXT
This will format numbers and dates. If you need to format a date to show as Jan-2026 or ensure numbers are displayed with leading zeros this can be really useful. Especially if you need data for a presentation or export.
Read More: How to Think Like a Data Analyst (Even If You’ve Never Touched a Spreadsheet
9.TEXTJOIN/CONCAT
These will join text together. TEXTJOIN is very useful as you can insert a delimiter such as a comma. Any blank cells will be ignored. This can be useful for creating full names, addresses etc.
10.LEFT, RIGHT, MID & TRIM
These will extract parts of text. LEFT & RIGHT will bring back characters from the beginning/end of text. MID will bring back characters from the middle. TRIM will remove any extra spaces. This can be really useful if you have messy data that has been imported.
11.EOMONTH/NETWORKDAYS
EOMONTH will return the last day of the month. This can be useful for end of period reporting. NETWORKDAYS will return the number of working days between two dates, excluding weekends and optional public holidays. These are often used in project or operations analysis.
Read More: Why Data Analytics Projects Matter So Much for Beginners
12.UNIQUE
This will return a list of unique values. This can be really useful to see how many unique customers/products/regions you have.
13.FILTER
This will filter your data to return only the rows that meet your conditions. If you want to see all of the orders above a certain value for one region this can be done instantly.
14.SORT
This will sort your range/array. This can be useful for having a clean list sorted.
15.SUMPRODUCT
This is a very flexible function. It allows you to multiply and sum arrays. Often it is used to replace complex SUMIFS or array formulas. It is commonly used by Business Analysts for weighted averages, conditional calculations and checking multiple conditions.
Why these are important to know
You won’t need to know all of these formulas. However, knowing the ones that will help you to look up related information, sum/count with conditions, clean text, date functions and provide clean summaries.
By knowing these 15 formulas you will be able to do the majority of analysis you need to do on a daily basis. By becoming familiar with these you will no longer be hindered by the spreadsheet.
At Ankashram we have courses like Think with Data that focus on these practical skills.
Frequently Asked Questions
Q1.Do I need to know all 15?
No. Start off with the ones you use the most. This will usually be XLOOKUP or INDEX+MATCH, SUMIFS, COUNTIFS and IF. Then as you need to use the others for actual tasks you can learn them.
Q2.Is XLOOKUP available in all versions of Excel?
It is available in Microsoft 365 and newer versions. If you have an older version INDEX + MATCH is a good alternative.
Q3.What is the difference between Pivot Tables?
Pivot Tables are brilliant for summarising data. However these formulas can give you more control if you need to do any custom calculations, clean your data or to have the results within a bigger model/dashboard.
Q4.Will they help if my data is messy?
Yes! TRIM, LEFT, RIGHT, MID, IFERROR and TEXT can all be really useful for cleaning up your data.
Q5.Do Ankashram teach these formulas?
Our practical courses like Think with Data focus on using tools like Excel. We focus on applying formulas to real situations.
Q6.Should I still learn Power Query/Power BI as a Business Analyst?
Yes, however knowing your formulas well will give you a strong base. Most analysts still spend a lot of time in spreadsheets and these formulas will make this much more productive.
Q7.What is the quickest way to become familiar?
Use them in real files. Try taking a report you use and using one of these formulas to replace any manual processes.