10 Data Analytics Projects For Beginners

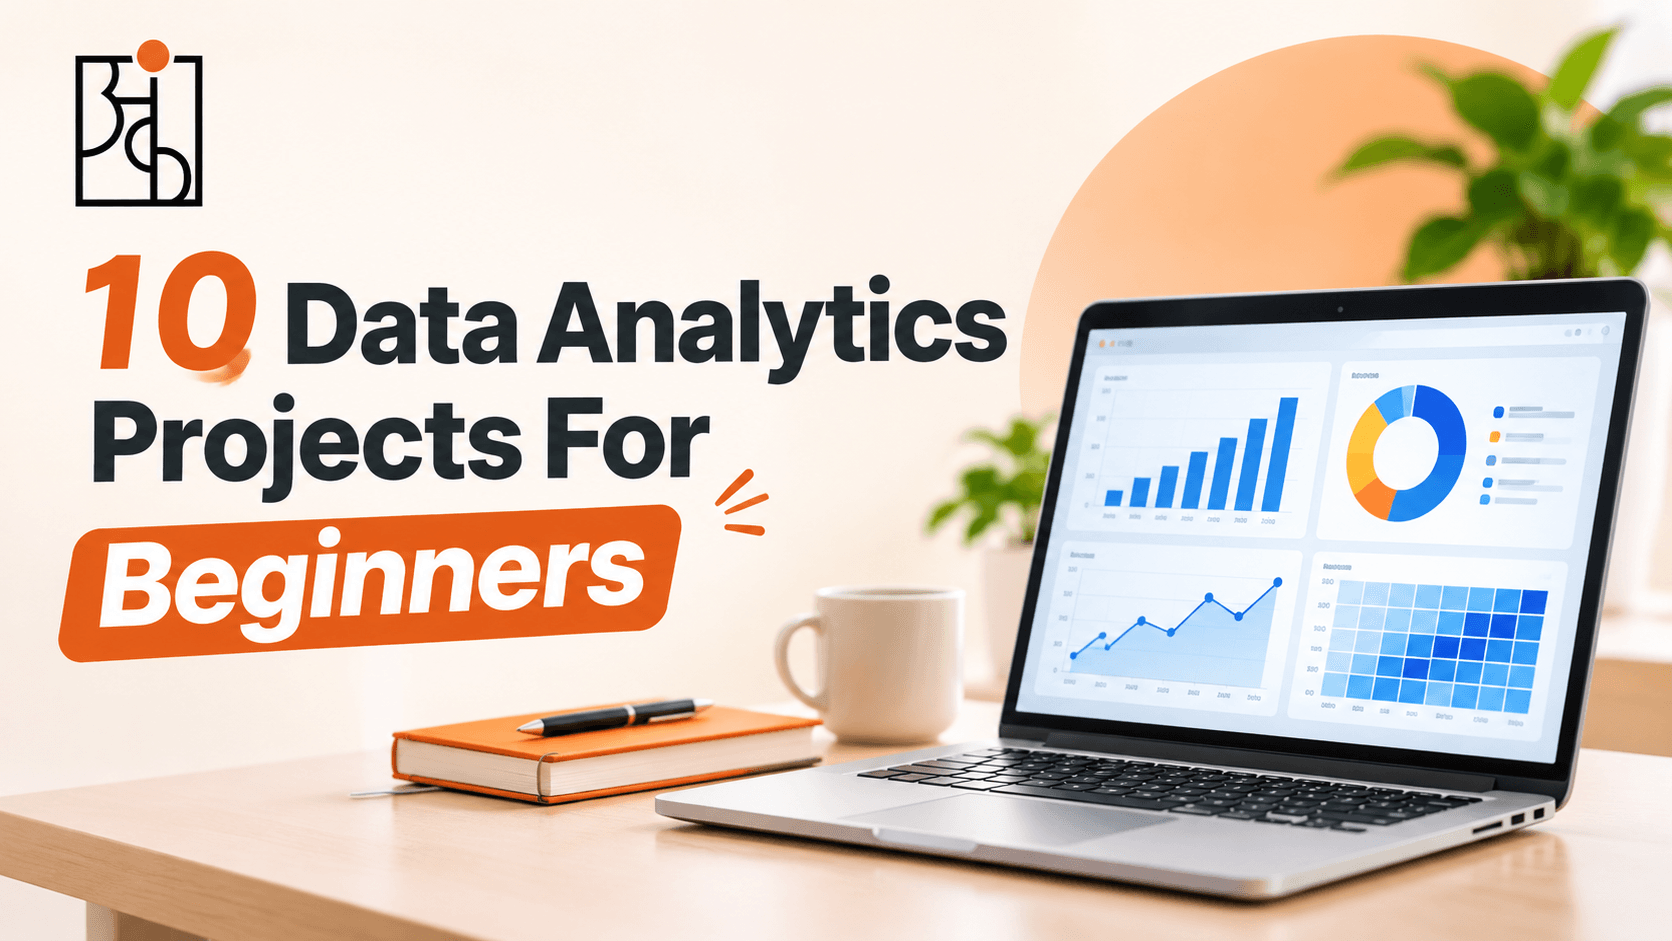
Data analytics can seem quite abstract when you are only learning through tutorials, however a great way to get a more hands-on experience is through doing some small projects with clear questions to answer. Below are some ideas for projects that can be completed in Excel, Google Sheets or free Power BI. These will help you gain some experience with how data analytics is used in real life roles. The projects don’t require any advanced coding skills but you’ll need to have a curious mind.
Table of Contents


1.Sales Dashboard
Create an overview using data which includes date, region, product and revenue. Create some basic visualisations to show the total revenue, top products and region performance. Add in some basic filtering to allow someone to filter by specific months.
Why it helps – The majority of businesses will track their sales. This helps you understand how to summarise your data.
Skills learnt – Pivot tables/simple visuals, SUMIFS formula, Clean formatting.
2.Customer Churn
Using data including customer interaction, last purchase date and whether they stayed/ left. Calculate a basic churn rate. Are there any patterns to the data such as certain regions having higher churn?
Why it helps – It’s more cost effective to retain customers. Forces you to start asking why.
Skills learnt – Rate calculations, Grouping data, Short notes.
3.Marketing Campaigns
Use sample data relating to campaigns or website traffic. Include data such as traffic, conversions, source and device. Find out which channels are bringing the most traffic and converting the best. If possible compare mobile vs desktop.
Why it helps – Marketing teams often want to know which campaigns are worth continuing. This helps you understand how to compare data.
Skills learnt – Grouping data, Conversion rates, Simple visuals.
4.Stock Status
Using data including product, quantity in stock, re-order level and how quickly they have been selling recently. Identify any products which are overstocked or are at risk of running out. Estimate how many days they have left in stock.
Why it helps – This is something operations and retail teams will be very interested in. Shows how data analytics can be used in day to day decisions.
Skills learnt – Conditional logic, Simple calculations, Highlighting issues.
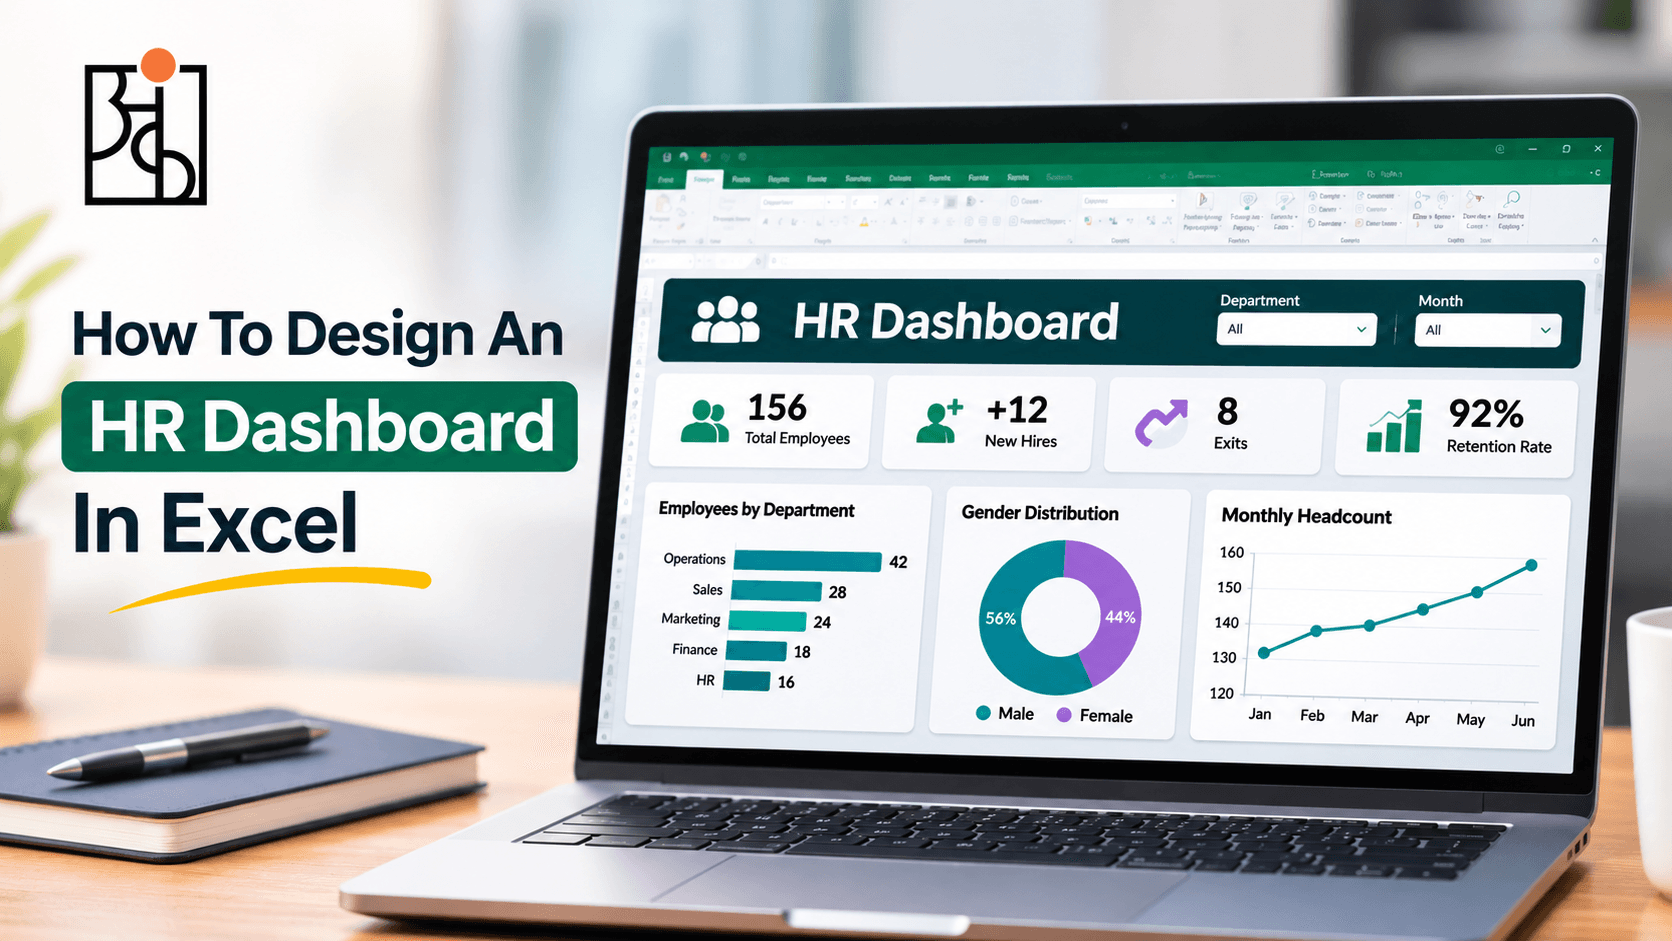
5.People Overview
Use anonymised data such as department, length of time in role or performance ratings. Find out the average length of time people have been in each team, distribution of ratings or completion of training.
Why it helps – Often HR or managers need clear people data. This can be done without any complex tools.
Skills learnt – Average calculations, Percentages, Grouping data, Careful data handling.
6.Expense Tracker
Use expense data including category, date and amount. Find out how much has been spent in each category, how it has changed over the months and what areas are costing the most. If you have any budget information, add a simple comparison.
Why it helps – Everyone can relate to this. Helps you gain confidence with time based and category based data.
Skills learnt – Date handling, SUMIFS/pivot table, Clean summary.
7.Product Margins
Use data including cost, selling price and units sold. Calculate the margin for each product and overall. Which products are the most profitable? Which is the most volume? Are there any products which are high volume but low margin?
Why it helps – Understanding margins will help you see that revenue isn’t everything. It’s a core part of understanding how healthy a business is.
Skills learnt – Calculated columns, Ranking, Volume and Profit.
8.Survey or Feedback Overview
Use survey data including ratings (and comments if available). Calculate the average score for each question or group. See how the data is distributed.
Why it helps – This data will appear in many areas such as product, HR or customer. Helps you gain experience of summarising opinion based data.
Skills learnt – Average, Frequency, Simple distribution.
9.Operational Efficiency
Use data including time taken, errors or completion rate. Calculate the average time taken to complete something, error rate and how it has changed over the weeks.
Why it helps – Operations teams love looking at efficiency data. Shows you how data analytics can be used to improve processes.
Skills learnt – Rate calculations, Time comparisons, Identifying outliers.
10.Basic Cohort Retention
Group customers by the month they joined. See how many people are still active in future months. Even a basic version will give you an understanding of cohorts.
Why it helps – Subscription and customer based businesses will want to understand retention. This gives an introduction to a more advanced concept.
Skills learnt – Grouping by joining period, Counting over time, Interpreting patterns.
How to get the most out of these projects
Choose one that feels relevant to your current knowledge. Use real or realistic example data. Ask yourself what you would like to know. Keep your initial version simple. It’s better to have a working summary than a complex incomplete model.
Once completed, write down 2-3 observations. This helps you turn the numbers into simple statements.
We here at Ankashram offer practical courses such as Think with Data to help you do this. Ankashram’s aim is to help you gain confidence to support decision making.
Read More: How to Think Like a Data Analyst (Even If You’ve Never Touched a Spreadsheet
Some tips
Use tools you already have – Excel, Google Sheets or free Power BI Desktop.
Keep your question simple.
Clean your data slightly.
Write your findings as if you were explaining to a colleague who hasn’t seen the file.
Save your versions so you can improve in the future.
Read More: Why Data Analytics Projects Matter So Much for Beginners
Frequently Asked Questions
Q1.Do I need any coding skills?
No! All can be completed using spreadsheets or basic Power BI. You can code in the future if you wish.
Q2.Where can I find example data?
Public data sets can be found on sites such as Kaggle or government open data. Sample data can also be found in Excel and Power BI tutorials. You can also create realistic example data.
Q3.How long should I spend?
Often you can create a focused initial version in a few hours or days. You can expand on this later.
Q4. Should I share these?
Yes! If you are creating a portfolio. Write down what you were trying to find out, what you did and the key findings. This will show how you think.
Q5.What if I get stuck?
Break the issue down into smaller parts. Check each calculation one at a time. Look for similar examples. Getting stuck is part of the learning process.
This is where Ankashram’s think with data course helps.
Q6.How will this help me in a real role?
This will help you develop good habits. You’ll be able to identify what you want to know, clean the data, calculate key numbers, identify patterns and explain what they mean.