How to Avoid Bias in Data Analysis: A Practical Guide

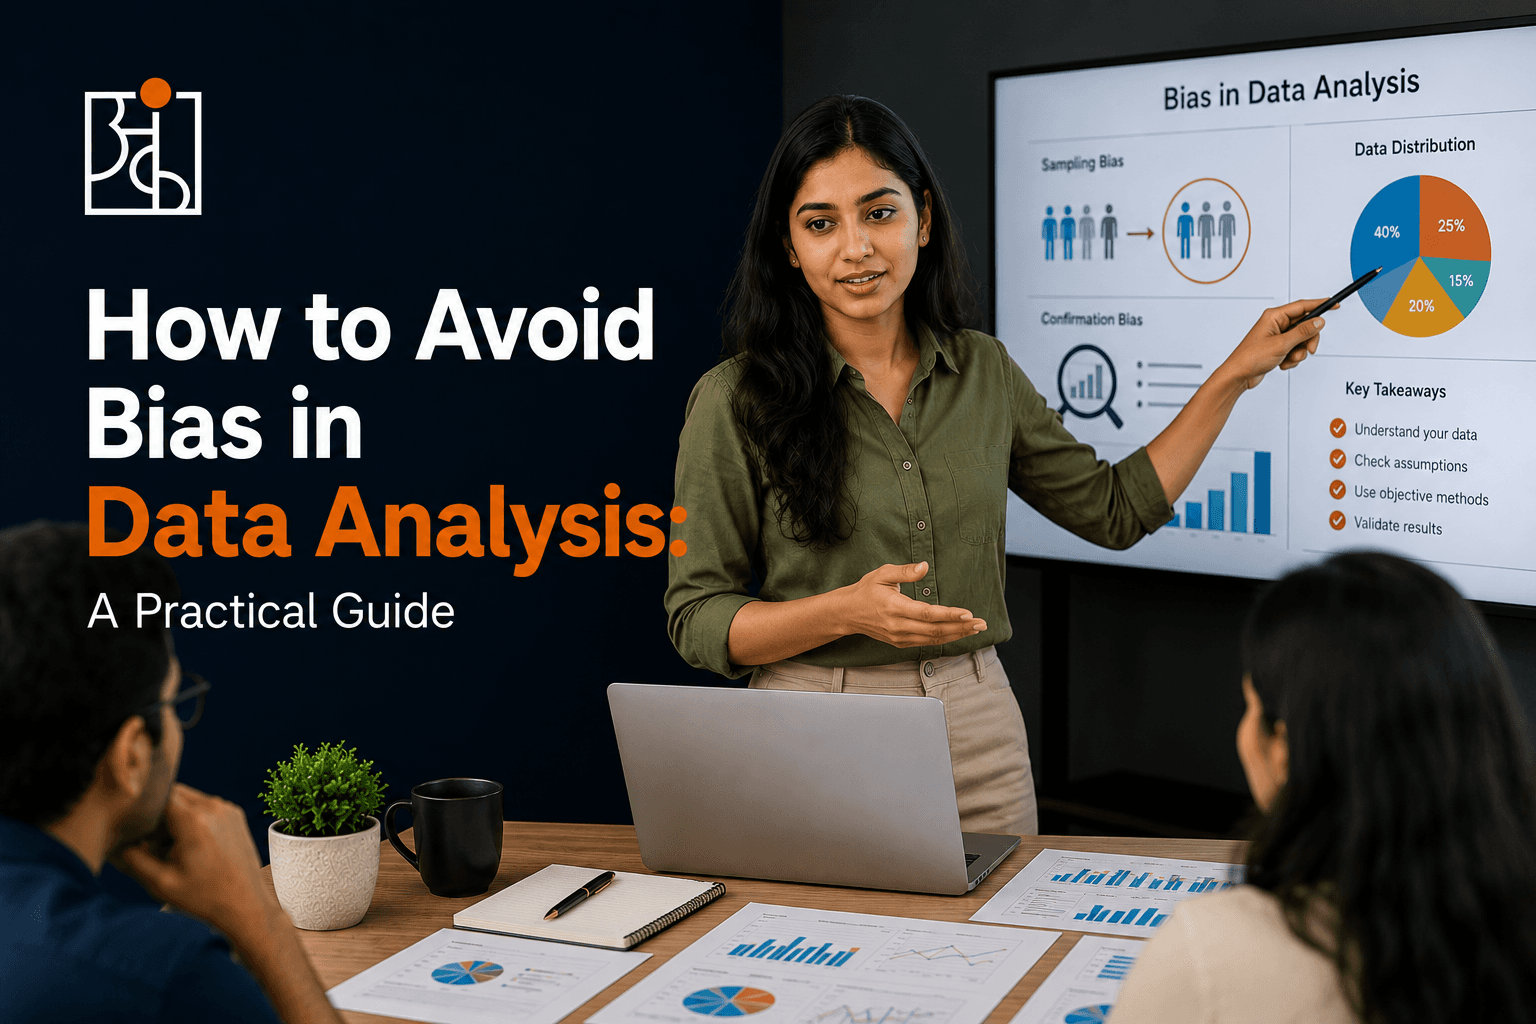
A hiring team once built a resume-screening model trained on ten years of past hiring decisions, expecting it to simply speed up a process that already worked well. It did speed things up. It also learned, on its own, to downrank candidates who’d taken career breaks — not because those candidates performed worse on the job, but because the historical data it trained on happened to contain very few hires who’d had one. Past hiring managers, for whatever reason, had rarely given them a chance in the first place. Nobody set out to build a discriminatory tool. The bias was already sitting inside the historical data, and the model simply learned to repeat a pattern nobody had thought to examine before automating it.
Table of Contents
That’s the part worth sitting with: bias in data analysis is rarely a matter of bad intentions. It’s a blind spot baked into a dataset, a question, or a method — invisible from the inside precisely because nothing about it looks wrong to the person running the analysis. Fixing it isn’t about becoming more honest. Most analysts already are. It’s about building specific habits that catch blind spots honesty alone was never going to fix.


When Your Data Was Never a Fair Sample
A call center evaluating customer satisfaction might only survey callers whose issues got fully resolved, since those are the interactions that reach a clean end point where sending a survey link makes sense. The resulting score can look strong — while saying nothing about the customers whose calls got dropped, escalated, or abandoned mid-frustration, which is exactly the group whose opinion would matter most for spotting a real problem. This is selection bias in its plainest form: the data that exists still feels complete from the inside, right up until someone asks who’s actually missing from it.
More of the same sample doesn’t fix this. What helps is asking, specifically, who or what got systematically excluded before drawing any conclusion from what’s left. A university studying which admitted students go on to succeed academically is only ever looking at students who were admitted — it has no visibility into how rejected applicants might have performed, which means any model built purely on admitted-student outcomes is structurally blind to most of the pool it’s implicitly making claims about.
Survivorship bias is the same problem wearing a different disguise: only the cases that made it far enough to be visible get counted, while the ones that dropped out early vanish from the dataset entirely. Study only the property flips that sold at a profit, and the pattern will always look encouraging, because every flip that lost money and quietly got abandoned or sold at a loss never made it into the analysis in the first place. Whatever shows up among the survivors can look like a winning formula when it might just be what’s left once the failures got filtered out. Tracking down the abandoned or loss-making cases too, even when it takes real effort to find them, is usually the only thing that turns a highlight reel back into an honest sample.
Testing What You Already Believe, and Calling It Confirmation
Confirmation bias rarely looks like ignoring evidence outright. It usually looks like asking a question already shaped to produce the expected answer, then treating that answer as neutral proof rather than as the predictable output of a leading question. An insurance company might start from a strong prior — that a particular demographic factor predicts claim frequency — and go looking specifically for data supporting that link, without running an equally serious search for data that would undermine it. The resulting model can look statistically solid while mostly reflecting the analyst’s starting assumption rather than any real underlying pattern, since the whole analysis was built to confirm one hypothesis instead of genuinely testing it against alternatives.
A close cousin of this, sometimes called HARKing — hypothesizing after results are known — happens when someone runs an open-ended analysis, notices a pattern in the output, and presents it as though it had been the original hypothesis all along. It sounds harmless. It quietly erases the difference between a hypothesis that survived a genuine test and a pattern that simply appeared once, in one dataset, by chance. Test enough variables and finding at least one coincidental correlation becomes almost guaranteed, whether or not any real relationship exists underneath it — a social media team testing dozens of content features for what drives engagement will eventually find something that correlates this particular week, regardless of whether it means anything at all.
Writing down a specific hypothesis, and what result would actually disprove it, before looking at the data closes most of this gap on its own. It feels almost bureaucratic in the moment. It’s also exactly the kind of small friction that catches a real problem before it ships.
When the Metric Itself Isn’t Neutral
Bias doesn’t only live in which data gets collected — it lives in how something gets measured to begin with, since choosing a metric always embeds an assumption about what actually matters. A call center that scores staff purely on average handle time is implicitly treating speed as the definition of quality, which punishes agents who take an extra two minutes to solve a hard problem properly and rewards agents who rush a customer off the phone without fixing anything.
This one is hard to catch because the metric itself looks perfectly objective — it’s just a number, minutes on a call, nothing subjective about it on the surface. The subjectivity sits one layer up, in the decision to treat that specific number as the thing worth optimizing for. Whenever a metric stands in for something more complicated — quality, engagement, success — the useful question is what it leaves out, and who ends up penalized by exactly that gap.
Climate datasets carry a quieter version of the same issue. Historical weather stations tend to cluster near cities, for entirely practical reasons that had nothing to do with future analysis, which means older records are weighted toward urban, accessible locations rather than a region as a whole. An analysis built on that history can end up describing urban trends more accurately than rural ones without anyone deliberately choosing to focus on cities at all — the bias arrived decades ago, through where instruments happened to get installed, not through anything the analyst using that data today actually decided.
Read More: How to Think Like a Data Analyst (Even If You’ve Never Touched a Spreadsheet)
The Traps That Show Up During Interpretation, Not Collection
Even a well-collected, well-measured dataset can still get read through a biased lens. Anchoring is the most common culprit — the first number seen shapes how every later number gets judged, whether or not that first figure deserved the weight it got. An analyst who sees an unusually high early estimate for a project’s return tends to judge every subsequent, more careful estimate against that initial anchor, long after the original number’s been shown to be flawed.
Groupthink shows up specifically in group settings, where a room reviewing the same finding ends up reinforcing an initial read instead of stress-testing it, especially once someone senior states a confident interpretation early. Junior team members tend to hesitate before contradicting a conclusion the most experienced person in the room has already backed, even when they’ve personally spotted something that doesn’t fit. Having people write their own independent read before any group discussion starts — rather than reacting to whoever speaks first — surfaces disagreement a normal conversation would have quietly papered over.
Read More: How to Improve Logical Thinking: A Practical Guide to Thinking Critically
Habits Worth Building In From the Start
A few concrete practices do more here than good intentions ever will. State the hypothesis and what would disprove it before the results arrive, not after. Ask who or what is missing from a dataset every single time, as a matter of routine rather than an occasional gut check. Treat a chosen metric as a decision that needs defending, not a neutral fact handed down from above. And build in a real, structured search for the explanation that would prove your working theory wrong — not a token pass, but an actual attempt to break it.
None of this needs exotic statistical training. It needs slowing down at specific, identifiable moments — before collecting data, before picking a metric, before accepting the first pattern that shows up — and asking one pointed question at each of them. The hiring team’s resume model wasn’t built by anyone trying to discriminate. It skipped exactly one of these questions: who’s missing from the historical data this thing is learning from. One missed question is usually enough for bias to slip through unnoticed. Encouragingly, it’s also usually enough to catch it, once someone remembers to ask.
Read More: How AI Is Transforming Data Analytics in 2026: A Complete Guide
Frequently Asked Questions
Q1.Is it possible to completely eliminate bias from a data analysis?
Not really — every dataset reflects choices about what got measured and how, and those choices always carry some perspective. The realistic goal is identifying the specific biases most likely to be present and checking for them on purpose, rather than assuming a large or precise-looking dataset is automatically neutral.
Q2. How is selection bias different from sampling bias?
The terms overlap heavily in practice. Sampling bias usually points to a flawed process for choosing who or what gets included in a dataset — surveying only customers who respond to email, for instance. Selection bias describes the broader outcome: the resulting data ends up unrepresentative of the group a conclusion gets applied to, however that mismatch actually happened.
Q3. Can a machine learning model be less biased than a human making the same decision?
It can be, but only if the training data and the objective it’s optimized for were built carefully enough to avoid encoding a past bias into the future. A model trained uncritically on biased historical decisions — like the resume-screening example — tends to reproduce and even amplify that bias at scale, applying the same flawed pattern to every case instead of just some of them.
Q4. What’s the single easiest habit to start with if I want to reduce bias in my own analysis?
Write down what you expect to find, and what result would actually prove you wrong, before looking at the data. This one habit catches a large share of confirmation bias on its own, since it forces a real test to exist before the results show up instead of after.
Related posts

How Data Analytics Helps Businesses Think With Data

Data Analytics for Working Professionals How to Actually Learn It Without Quitting Your Job