Sales Data Analysis Project Using Excel: A Step-by-Step Example

Here’s a scene almost every beginner’s lived through. Tutorials? Watched. Pivot tables? Can define one, no problem. Then someone actually drops a real sales spreadsheet in front of them — a few thousand rows, dates that don’t match each other, a product name spelled two different ways somewhere in there — and suddenly it’s just… staring. No idea where to even click first.
Table of Contents
That gap, the one between “knows the tools” and “actually knows what to do with real data,” is the whole reason first projects exist. Sales data happens to be a great place to close that gap, mostly because nobody needs it explained — everyone already gets what a sale is — and because it’s messy in exactly the right way. Not chaotic. Just realistically, teachably messy. What follows is a full sales project in Excel, start to finish, the way it actually plays out — not the suspiciously tidy version most tutorials show, where the data’s already been scrubbed before you ever see it.
Read More: How to Improve Logical Thinking: A Practical Guide to Thinking Critically


Why Sales Data, of All Things
Worth pausing on this before jumping into steps. Sales data works so well as a first project partly because most people already carry a rough intuition for it — more revenue, generally good; a sudden drop, worth poking at; some regions or products just doing better than others. That gut sense means a beginner can actually tell if their own analysis feels right, instead of flying completely blind the way they might with, say, genomics data or some industrial sensor feed nobody outside the field has a feel for.
And the mess is just… useful. Real sales records show up with mismatched date formats, a typo in a product name somewhere down the sheet, a blank discount field here and there, maybe a duplicate row from some glitch nobody caught. That’s friction worth having — enough to force real cleaning instincts, not so much that a beginner gives up before row 50.
Step 1: The Question Comes Before the Spreadsheet, Not After
Far and away the most common mistake: opening the file first, figuring out the question later. Backwards, every time — and it tends to spit out a pile of charts that don’t actually add up to anything when you step back and look at them together.
Before Excel’s even open, it’s worth nailing down a real question. Something like “which product categories are driving the most revenue, and has that shifted over the past year” — testable, specific, something you can actually go chase. “Let’s just explore the data” sounds like a plan. It isn’t one. It’s just delayed confusion.
For this walkthrough, the question’s close to what a small retail business might genuinely want answered: which products and regions are pulling their weight, and is there a seasonal rhythm worth planning the year around?
Read More: How to Improve Logical Thinking: A Practical Guide to Thinking Critically
Step 2: Just Look at the Thing First
Question in hand, next move is opening the dataset and actually looking at it — not analyzing yet, just taking stock. A typical sales file for this kind of project might carry columns like Order ID, Date, Product Category, Product Name, Region, Units Sold, Unit Price, Discount.
Right now, the only job is spotting trouble. Dates all the same format, or does one row say 04/08/2026 and another says 2026-08-04 like they’re from two different planets? Is “North Region” spelled the same way everywhere, or does “north region” and “North Reg.” show up somewhere further down, quietly fracturing what should be one category into three? Any blanks sitting where there shouldn’t be any? Nothing gets touched yet — this is just building the list Step 3’s about to work through.
Step 3: Clean It (The Part Nobody Looks Forward To, Everybody Needs)
Least fun step on this whole list, hands down. Also probably the step that actually separates someone who can work with data from someone who can only work with data that’s already been handed to them spotless.
Dates first. Select the column, Format Cells, force everything into one shape. If some snuck in as plain text instead of real date values, a quick Text to Columns pass under the Data tab usually sorts it — and it matters a lot later, the second you try building anything that tracks a trend over time.
Then the inconsistent categories. Find & Replace catches the obvious stuff — “north region” becoming “North Region,” say. On a bigger file, Remove Duplicates and Data Validation help surface the sneakier inconsistencies a quick scan just won’t catch.
Missing values need an actual decision, not an autopilot fix. A blank Discount cell probably just means nothing got applied — filling that with zero is a reasonable, low-risk call. A blank in Units Sold? Completely different story. That one needs real digging, not a guess, because inventing a number there quietly poisons every total that gets built on top of it later, and you won’t even know where it went wrong.
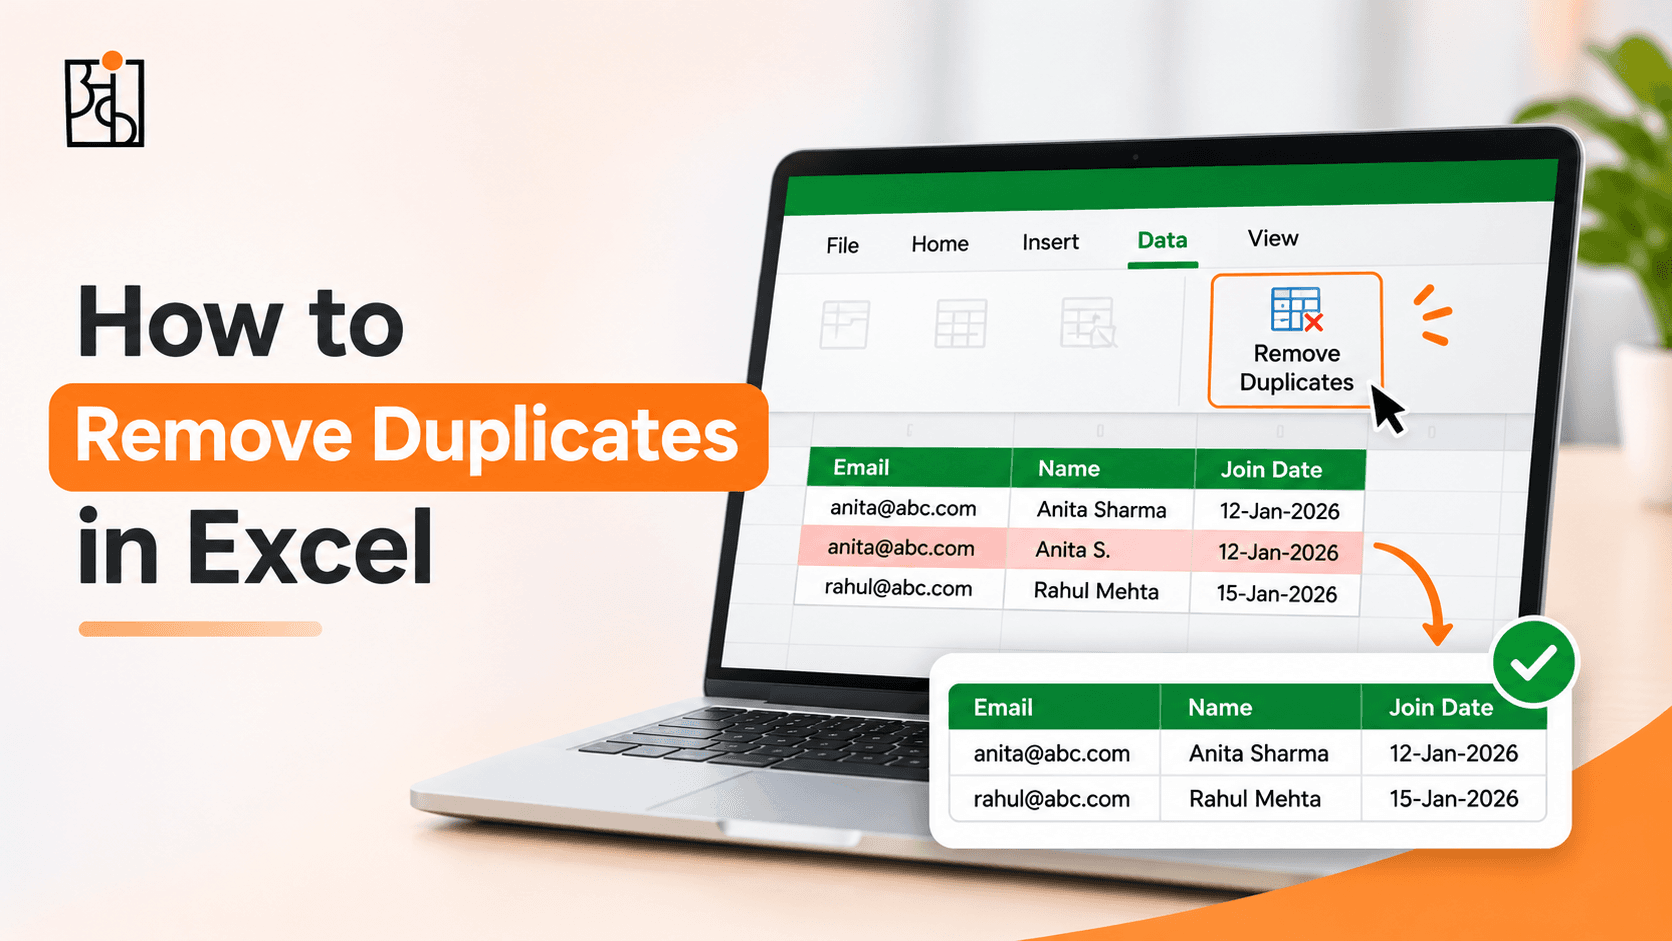
Last, the actual duplicates. Remove Duplicates, under the Data tab, handles the bulk of it fast — but worth manually checking a few flagged rows first. Something that looks duplicated might just be two separate, totally legitimate orders placed four minutes apart by two different customers.
This step eats more time than people expect, basically every time, and that’s not a sign anything’s wrong. Real data’s messy because real businesses are messy, full stop — and honestly, a surprising chunk of the actual thinking in this whole field happens right here, elbow-deep in cleanup, not in the fancy chart at the end.
Read More: How to Think Like a Data Analyst (Even If You’ve Never Touched a Spreadsheet
Step 4: A Couple of Columns Worth Building Once
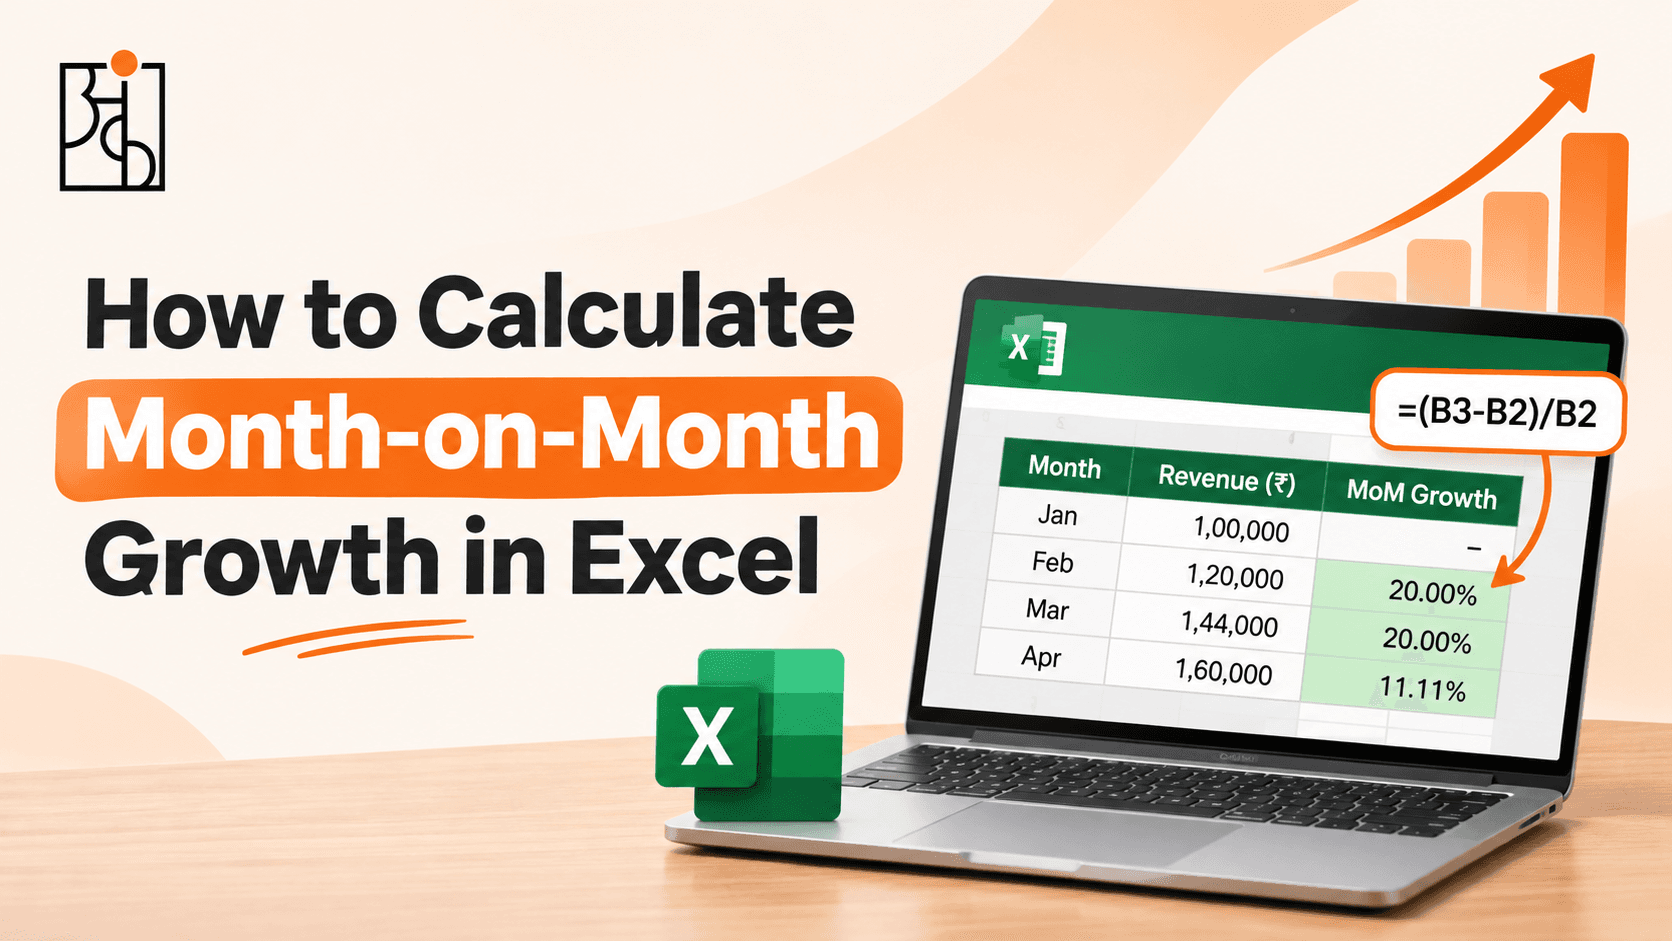
Data’s clean now, so a couple of new columns make everything after this easier. A Total Sale Value column — Units Sold × Unit Price × (1 − Discount) — turns raw line items into something you can actually sum up and compare like it means something. A Month column, pulled out with something like =TEXT(A2,”mmm-yyyy”), lets everything get grouped by time period without re-deriving the same thing five times later.
Small as these feel, skipping them bites later. Without them, the same calculation ends up getting rebuilt across five separate charts — slower, and way more room for a tiny mistake to slip in somewhere and quietly throw everything off.
Step 5: Pivot Tables — This Is Where the Project Actually Starts Working
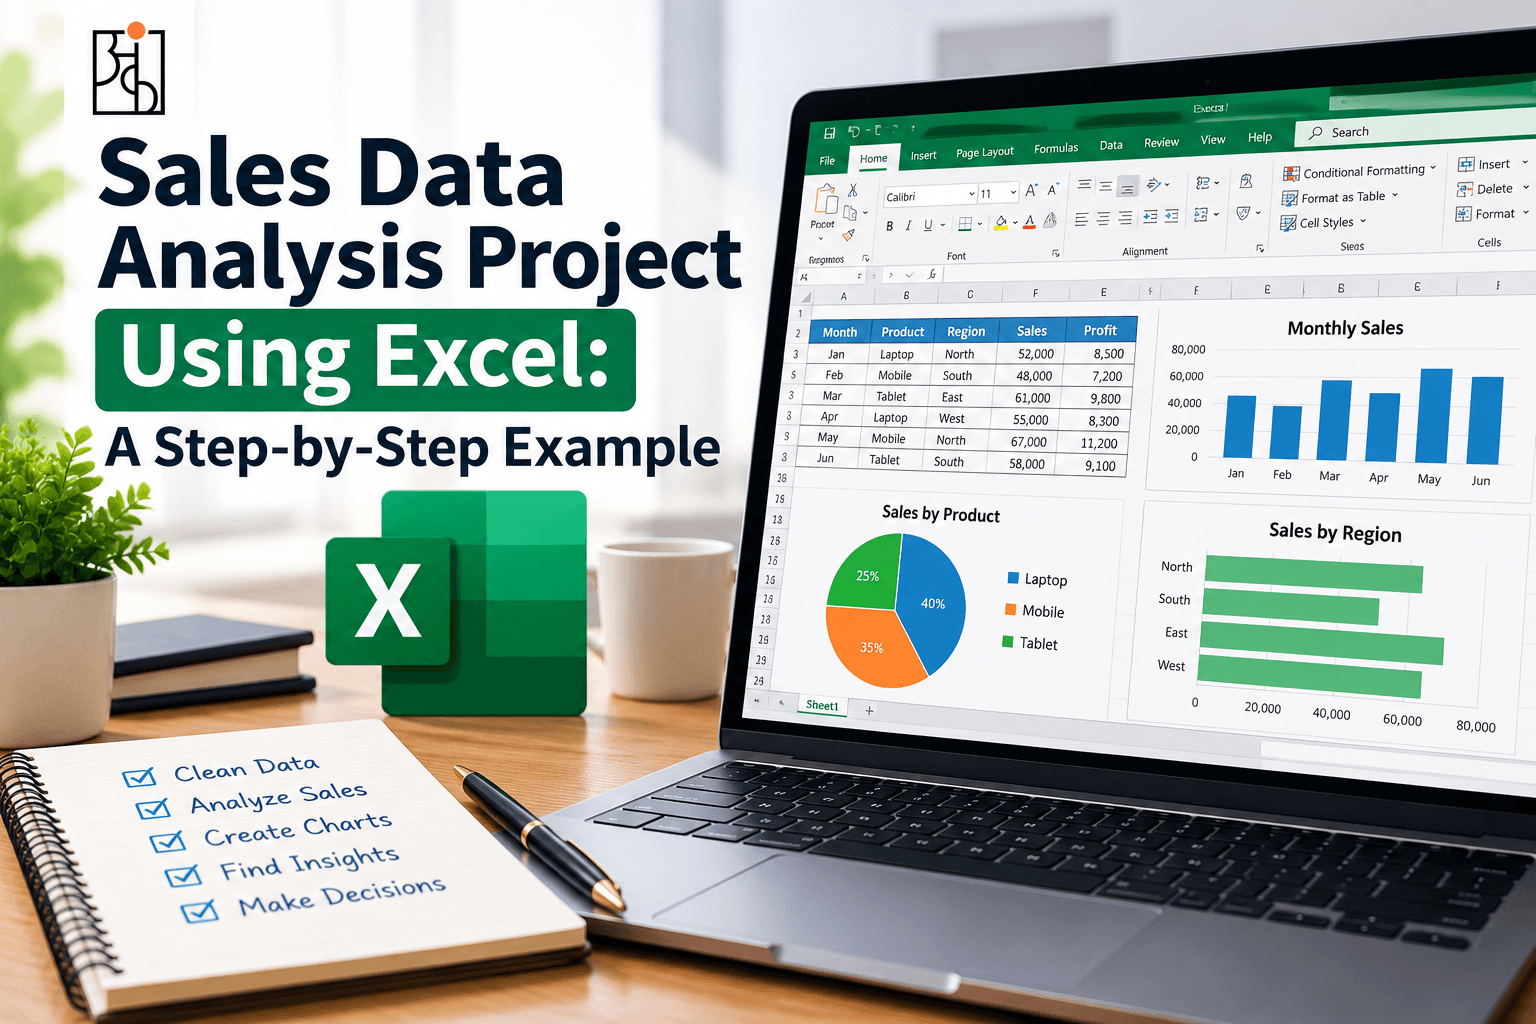
Here’s where real answers start showing up instead of just clean rows sitting there looking nice. Select the whole dataset, Insert → PivotTable, drop Product Category into Rows, Total Sale Value into Values. Few seconds later, thousands of individual transactions have collapsed into a handful of totals you can actually read and make sense of — exactly the kind of summary a real decision actually leans on.
From there, rebuild the same table a few different ways to actually chase the original question down. Swap Product Category for Region, see which markets are doing the heavy lifting. Stack Month in alongside Product Category, check whether certain categories spike at certain times — holiday-driven stuff especially tends to hide a pattern that’s totally invisible sitting in the raw, ungrouped rows.
This is usually the exact moment a beginner has their first genuine “oh — okay, this is actually useful” moment with Excel. Not because pivot tables are some complicated technical feat. They’re not. It’s because they turn an unreadable wall of rows into something a person can actually look at and reason through.
Step 6: Chart What Actually Matters
Once the pivot tables turn up something worth showing, a chart gets the point across faster than any table of numbers could manage on its own. Line chart for revenue by month — built exactly for showing a trend over time clearly. Bar chart for comparing categories or regions head to head. And maybe skip the pie chart once you’re past three or four categories — looks friendly enough, sure, but it’s genuinely one of the weaker chart types once precision matters, since human eyes just aren’t that good at judging angles against each other.
Keep each chart narrow. One chart, one point, done. Try to cram category performance, regional performance, and a monthly trend into one single chart, and odds are none of the three come through clearly.
Read More : Online vs Offline Data Analytics Course Which Is Actually Better?
Step 7: Find the Story Hiding in There — Not Just the Numbers
This is the step a lot of beginner projects skip right past, and it might be the one that matters most on this whole list. A stack of correct pivot tables and clean charts isn’t analysis. Not yet. It’s just processed data, sitting there, patiently waiting for someone to actually say what it means.
Look at sales by month — is there a real seasonal shape to it, and does that shape actually make sense for the business (holiday spike, back-to-school bump, whatever fits)? Look at sales by region — is one region quietly lagging behind, worth a closer look, or is there an obvious reason already sitting right there, like a smaller population to sell into? Look at sales by category — is one category carrying way more than its share of revenue, maybe enough to justify shifting inventory or marketing attention its way?
Turning observations like that into two or three plain sentences is really what makes something read as actual analysis — not a folder of charts somebody happened to generate along the way and never quite explained.
Step 8: Wrap the Conclusion So It’s Actually Usable
Last step — hand the work over the way a real stakeholder would actually want it, not every chart built along the way, just the two or three findings that genuinely matter, said plainly. Something like: “Electronics drove 42% of total revenue, with a clear spike in November and December. The North region underperformed every other region by a wide margin and probably deserves a closer look.”
That’s basically the whole difference between a project that reads like a technical exercise and one that reads like real analytical work. The second one sounds like something a hiring manager could genuinely act on — not just nod politely at and move on.
Read More : Building Your First Power BI Dashboard (The Order Matters)
What a Project Like This Actually Proves
Step back and look at the whole thing, and it shows a lot more than just knowing Excel. It shows asking a real question before ever touching the data. Actually cleaning a messy, real dataset instead of working around one that’s already been scrubbed clean for you ahead of time. Building the right kind of summary for the actual question instead of defaulting to whatever chart’s familiar. And turning a pile of numbers into something someone could genuinely act on.
This is basically the structure Ankashram builds its own training around — not theory floating in isolation somewhere, but a full project, walked start to finish, cleanup step included, instead of quietly skipping past the unglamorous part the way most tutorials do. A beginner who can walk an interviewer through something like this — explaining each choice as they go, not just presenting a finished chart — tends to stand out a lot more than someone who can only describe what a pivot table is in the abstract. That difference is kind of the whole point behind how Ankashram teaches this stuff: build something real enough to actually defend out loud, not just another line item on a certificate list.
A Few Tips for Trying This on Your Own Data
Pick a dataset with a bit of genuine mess baked in — a perfectly clean file quietly skips the exact skill this whole thing’s meant to build in the first place. Write the guiding question down before Excel even opens, so things stay anchored instead of drifting into aimless poking around for an hour. Jot a short note for every cleaning call made along the way — why a blank got filled with zero, why a row got tossed — because that reasoning is almost always exactly what gets asked about later, in an interview or anywhere else. And resist the urge to build ten charts when two or three, picked carefully, would land the point a lot harder.
Frequently Asked Questions
Q1.Do I need advanced Excel skills to do a sales data analysis project?
Not really, no. Pivot tables, a few basic formulas (Text to Columns, TEXT()), and standard charts cover most of what a solid first project actually needs. Macros and Power Query are nice to have later, but nobody needs them to get started here.
Q2.Where can I actually find a sales dataset to practice on?
Kaggle’s got plenty of realistic public sales data floating around, or something personal works just as well — your own spending, sales from some small side project, whatever’s lying around. The one thing worth looking for is a bit of realistic mess, not a file that’s already spotless before you open it.
Q3.How long should something like this actually take?
For a beginner, a few hours spread across a couple of sittings feels about right. Cleaning the data almost always eats more time than expected — usually more than the charts and pivot tables that come after it.
Q4.What’s the mistake beginners make most often here?
Skipping the real question at the very start, and skipping the plain-language conclusion at the very end. Miss those two bookends, and the whole thing ends up as a pile of technically correct charts with nothing actually tying them together into a point.
Q5.Pivot tables or formulas like SUMIFS — which one should I actually use?
Pivot tables are generally faster to build and way easier to rearrange on the fly, which makes them great for poking at a dataset from a few angles quickly, one after another. SUMIFS and similar formulas earn their place when one specific calculation needs to update automatically as fresh data keeps coming in.
Q6.How does a project like this actually help in a job interview?
Gives you something concrete to actually walk through — what question got asked, what the data looked like before anyone touched it, the choices made along the way and why, what the conclusion ended up being. Miles stronger than describing Excel skills in the abstract, and it’s exactly the kind of walkthrough Ankashram pushes learners toward building for themselves.